Google Lighthouse has been one of the most effective ways to gamify and promote web page performance among developers. Using Lighthouse, we can assess web pages based on overall performance, accessibility, SEO, and what Google considers “best practices”, all with the click of a button.
We might use these tests to evaluate out-of-the-box performance for front-end frameworks or to celebrate performance improvements gained by some diligent refactoring. And you know you love sharing screenshots of your perfect Lighthouse scores on social media. It’s a well-deserved badge of honor worthy of a confetti celebration.
Just the fact that Lighthouse gets developers like us talking about performance is a win. But, whilst I don’t want to be a party pooper, the truth is that web performance is far more nuanced than this. In this article, we’ll examine how Google Lighthouse calculates its performance scores, and, using this information, we will attempt to “hack” those scores in our favor, all in the name of fun and science — because in the end, Lighthouse is simply a good, but rough guide for debugging performance. We’ll have some fun with it and see to what extent we can “trick” Lighthouse into handing out better scores than we may deserve.
But first, let’s talk about data.
Field Data Is Important
Contents
- 1 Field Data Is Important
- 2 Web Performance Is More Than Numbers
- 3 How Google Lighthouse Performance Scores Are Calculated
- 4 Usability Is Favored Over Raw Speed
- 5 Can We “Trick” Google Lighthouse?
- 6 How to Hack FCP and LCP Scores
- 7 How to Hack CLS Scores
- 8 You Can’t Hack a Speed Index Score
- 9 You Also Can’t (Really) Hack A TBT Score
- 10 Bottom Line: Lighthouse Is Still Just A Rough Guide
- 11 Some More Silly Hacks
Local performance testing is a great way to understand if your website performance is trending in the right direction, but it won’t paint a full picture of reality. The World Wide Web is the Wild West, and collectively, we’ve almost certainly lost track of the variety of device types, internet connection speeds, screen sizes, browsers, and browser versions that people are using to access websites — all of which can have an impact on page performance and user experience.
Field data — and lots of it — collected by an application performance monitoring tool like Sentry from real people using your website on their devices will give you a far more accurate report of your website performance than your lab data collected from a small sample size using a high-spec super-powered dev machine under a set of controlled conditions. Philip Walton reported in 2021 that “almost half of all pages that scored 100 on Lighthouse didn’t meet the recommended Core Web Vitals thresholds” based on data from the HTTP Archive.
Web performance is more than a single core web vital metric or Lighthouse performance score. What we’re talking about goes way beyond the type of raw data we’re working with.
Web Performance Is More Than Numbers
Speed is often the first thing that comes up when talking about web performance — just how long does a page take to load? This isn’t the worst thing to measure, but we must bear in mind that speed is probably influenced heavily by business KPIs and sales targets. Google released a report in 2018 suggesting that the probability of bounces increases by 32% if the page load time reaches higher than three seconds, and soars to 123% if the page load time reaches 10 seconds. So, we must conclude that converting more sales requires reducing bounce rates. And to reduce bounce rates, we must make our pages load faster.
But what does “load faster” even mean? At some point, we’re physically incapable of making a web page load any faster. Humans — and the servers that connect them — are spread around the globe, and modern internet infrastructure can only deliver so many bytes at a time.
The bottom line is that page load is not a single moment in time. In an article titled “What is speed?” Google explains that a page load event is:
[…] “an experience that no single metric can fully capture. There are multiple moments during the load experience that can affect whether a user perceives it as ‘fast’, and if you just focus solely on one, you might miss bad experiences that happen during the rest of the time.”
The key word here is experience. Real web performance is less about numbers and speed than it is about how we experience page load and page usability as users. And this segues nicely into a discussion of how Google Lighthouse calculates performance scores. (It’s much less about pure speed than you might think.)
How Google Lighthouse Performance Scores Are Calculated
The Google Lighthouse performance score is calculated using a weighted combination of scores based on core web vital metrics (i.e., First Contentful Paint (FCP), Largest Contentful Paint (LCP), Cumulative Layout Shift (CLS)) and other speed-related metrics (i.e., Speed Index (SI) and Total Blocking Time (TBT)) that are observable throughout the page load timeline.
This is how the metrics are weighted in the overall score:
| Metric | Weighting (%) |
|---|---|
| Total Blocking Time | 30 |
| Cumulative Layout Shift | 25 |
| Largest Contentful Paint | 25 |
| First Contentful Paint | 10 |
| Speed Index | 10 |
The weighting assigned to each score gives us insight into how Google prioritizes the different building blocks of a good user experience:
1. A Web Page Should Respond to User Input
The highest weighted metric is Total Blocking Time (TBT), a metric that looks at the total time after the First Contentful Paint (FCP) to help indicate where the main thread may be blocked long enough to prevent speedy responses to user input. The main thread is considered “blocked” any time there’s a JavaScript task running on the main thread for more than 50ms. Minimizing TBT ensures that a web page responds to physical user input (e.g., key presses, mouse clicks, and so on).
2. A Web Page Should Load Useful Content With No Unexpected Visual Shifts
The next most weighted Lighthouse metrics are Largest Contentful Paint (LCP) and Cumulative Layout Shift (CLS). LCP marks the point in the page load timeline when the page’s main content has likely loaded and is therefore useful.
At the point where the main content has likely loaded, you also want to maintain visual stability to ensure that users can use the page and are not affected by unexpected visual shifts (CLS). A good LCP score is anything less than 2.5 seconds (which is a lot higher than we might have thought, given we are often trying to make our websites as fast as possible).
3. A Web Page Should Load Something
The First Contentful Paint (FCP) metric marks the first point in the page load timeline where the user can see something on the screen, and the Speed Index (SI) measures how quickly content is visually displayed during page load over time until the page is “complete”.
Your page is scored based on the speed indices of real websites using performance data from the HTTP Archive. A good FCP score is less than 1.8 seconds and a good SI score is less than 3.4 seconds. Both of these thresholds are higher than you might expect when thinking about speed.
Usability Is Favored Over Raw Speed
Google Lighthouse’s performance scoring is, without a doubt, less about speed and more about usability. Your SI and FCP could be super quick, but if your LCP takes too long to paint, and if CLS is caused by large images or external content taking some time to load and shifting things visually, then your overall performance score will be lower than if your page was a little slower to render the FCP but didn’t cause any CLS. Ultimately, if the page is unresponsive due to JavaScript blocking the main thread for more than 50ms, your performance score will suffer more than if the page was a little slow to paint the FCP.
To understand more about how the weightings of each metric contribute to the final performance score, you can play about with the sliders on the Lighthouse Scoring Calculator, and here’s a rudimentary table demonstrating the effect of skewed individual metric weightings on the overall performance score, proving that page usability and responsiveness is favored over raw speed.
| Description | FCP (ms) | SI (ms) | LCP (ms) | TBT (ms) | CLS | Overall Score |
|---|---|---|---|---|---|---|
| Slow to show something on screen | 6000 | 0 | 0 | 0 | 0 | 90 |
| Slow to load content over time | 0 | 5000 | 0 | 0 | 0 | 90 |
| Slow to load the largest part of the page | 0 | 0 | 6000 | 0 | 0 | 76 |
| Visual shifts occurring during page load | 0 | 0 | 0 | 0 | 0.82 | 76 |
| Page is unresponsive to user input | 0 | 0 | 0 | 2000 | 0 | 70 |
The overall Google Lighthouse performance score is calculated by converting each raw metric value into a score from 0 to 100 according to where it falls on its Lighthouse scoring distribution, which is a log-normal distribution derived from the performance metrics of real website performance data from the HTTP Archive. There are two main takeaways from this mathematically overloaded information:
- Your Lighthouse performance score is plotted against real website performance data, not in isolation.
- Given that the scoring uses log-normal distribution, the relationship between the individual metric values and the overall score is non-linear, meaning you can make substantial improvements to low-performance scores quite easily, but it becomes more difficult to improve an already high score.
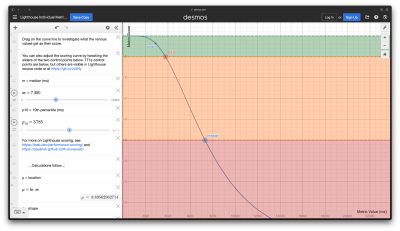
Read more about how metric scores are determined, including a visualization of the log-normal distribution curve on developer.chrome.com.
Can We “Trick” Google Lighthouse?
I appreciate Google’s focus on usability over pure speed in the web performance conversation. It urges developers to think less about aiming for raw numbers and more about the real experiences we build. That being said, I’ve wondered whether today in 2024, it’s possible to fool Google Lighthouse into believing that a bad page in terms of usability and usefulness is actually a great one.
I put on my lab coat and science goggles to investigate. All tests were conducted:
- Using the Chromium Lighthouse plugin,
- In an incognito window in the Arc browser,
- Using the “navigation” and “mobile” settings (apart from where described differently),
- By me, in a lab (i.e., no field data).
That all being said, I fully acknowledge that my controlled test environment contradicts my advice at the top of this post, but the experiment is an interesting ride nonetheless. What I hope you’ll take away from this is that Lighthouse scores are only one piece — and a tiny one at that — of a very large and complex web performance puzzle. And, without field data, I’m not sure any of this matters anyway.
How to Hack FCP and LCP Scores
TL;DR: Show the smallest amount of LCP-qualifying content on load to boost the FCP and LCP scores until the Lighthouse test has likely finished.
FCP marks the first point in the page load timeline where the user can see anything at all on the screen, while LCP marks the point in the page load timeline when the main page content (i.e., the largest text or image element) has likely loaded. A fast LCP helps reassure the user that the page is useful. “Likely” and “useful” are the important words to bear in mind here.
What Counts as an LCP Element
The types of elements on a web page considered by Lighthouse for LCP are:
<img>elements,<image>elements inside an<svg>element,<video>elements,- An element with a background image loaded using the
url()function, (and not a CSS gradient), and - Block-level elements containing text nodes or other inline-level text elements.
The following elements are excluded from LCP consideration due to the likelihood they do not contain useful content:
- Elements with zero opacity (invisible to the user),
- Elements that cover the full viewport (likely to be background elements), and
- Placeholder images or other images with low entropy (i.e., low informational content, such as a solid-colored image).
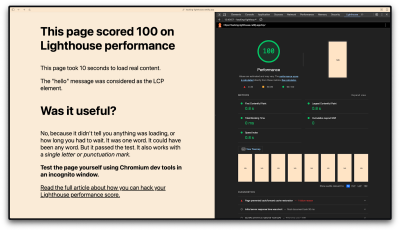
However, the notion of an image or text element being useful is completely subjective in this case and generally out of the realm of what machine code can reliably determine. For example, I built a page containing nothing but a <h1> element where, after 10 seconds, JavaScript inserts more descriptive text into the DOM and hides the <h1> element.
Lighthouse considers the heading element to be the LCP element in this experiment. At this point, the page load timeline has finished, but the page’s main content has not loaded, even though Lighthouse thinks it is likely to have loaded within those 10 seconds. Lighthouse still awards us with a perfect score of 100 even if the heading is replaced by a single punctuation mark, such as a full stop, which is even less useful.
This test suggests that if you need to load page content via client-side JavaScript, we‘ll want to avoid displaying a skeleton loader screen since that requires loading more elements on the page. And since we know the process will take some time — and that we can offload the network request from the main thread to a web worker so it won’t affect the TBT — we can use some arbitrary “splash screen” that contains a minimal viable LCP element (for better FCP scoring). This way, we’re giving Lighthouse the impression that the page is useful to users quicker than it actually is.
All we need to do is include a valid LCP element that contains something that counts as the FCP. While I would never recommend loading your main page content via client-side JavaScript in 2024 (serve static HTML from a CDN instead or build as much of the page as you can on a server), I would definitely not recommend this “hack” for a good user experience, regardless of what the Lighthouse performance score tells you. This approach also won’t earn you any favors with search engines indexing your site, as the robots are unable to discover the main content while it is absent from the DOM.
I also tried this experiment with a variety of random images representing the LCP to make the page even less useful. But given that I used small file sizes — made smaller and converted into “next-gen” image formats using a third-party image API to help with page load speed — it seemed that Lighthouse interpreted the elements as “placeholder images” or images with “low entropy”. As a result, those images were disqualified as LCP elements, which is a good thing and makes the LCP slightly less hackable.
View the demo page and use Chromium DevTools in an incognito window to see the results yourself.
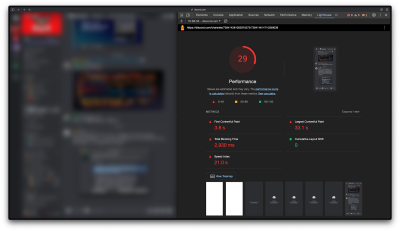
This hack, however, probably won’t hold up in many other use cases. Discord, for example, uses the “splash screen” approach when you hard-refresh the app in the browser, and it receives a sad 29 performance score.
Compared to my DOM-injected demo, the LCP element was calculated as some content behind the splash screen rather than elements contained within the splash screen content itself, given there were one or more large images in the focussed text channel I tested on. One could argue that Lighthouse scores are less important for apps that are behind authentication anyway: they don’t need to be indexed by search engines.
There are likely many other situations where apps serve user-generated content and you might be unable to control the LCP element entirely, particularly regarding images.
For example, if you can control the sizes of all the images on your web pages, you might be able to take advantage of an interesting hack or “optimization” (in very large quotes) to arbitrarily game the system, as was the case of RentPath. In 2021, developers at RentPath managed to improve their Lighthouse performance score by 17 points when increasing the size of image thumbnails on a web page. They convinced Lighthouse to calculate the LCP element as one of the larger thumbnails instead of a Google Map tile on the page, which takes considerably longer to load via JavaScript.
The bottom line is that you can gain higher Lighthouse performance scores if you are aware of your LCP element and in control of it, whether that’s through a hack like RentPath’s or mine or a real-deal improvement. That being said, whilst I’ve described the splash screen approach as a hack in this post, that doesn’t mean this type of experience couldn’t offer a purposeful and joyful experience. Performance and user experience are about understanding what’s happening during page load, and it’s also about intent.
How to Hack CLS Scores
TL;DR: Defer loading content that causes layout shifts until the Lighthouse test has likely finished to make the test think it has enough data. CSS transforms do not negatively impact CLS, except if used in conjunction with new elements added to the DOM.
CLS is measured on a decimal scale; a good score is less than 0.1, and a poor score is greater than 0.25. Lighthouse calculates CLS from the largest burst of unexpected layout shifts that occur during a user’s time on the page based on a combination of the viewport size and the movement of unstable elements in the viewport between two rendered frames. Smaller one-off instances of layout shift may be inconsequential, but a bunch of layout shifts happening one after the other will negatively impact your score.
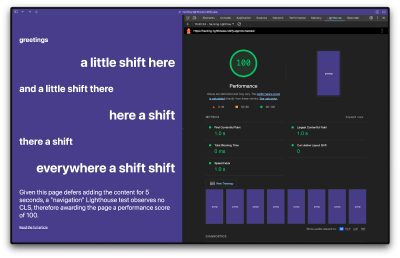
If you know your page contains annoying layout shifts on load, you can defer them until after the page load event has been completed, thus fooling Lighthouse into thinking there is no CLS. This demo page I created, for example, earns a CLS score of 0.143 even though JavaScript immediately starts adding new text elements to the page, shifting the original content up. By pausing the JavaScript that adds new nodes to the DOM by an arbitrary five seconds with a setTimeout(), Lighthouse doesn’t capture the CLS that takes place.
This other demo page earns a performance score of 100, even though it is arguably less useful and useable than the last page given that the added elements pop in seemingly at random without any user interaction.
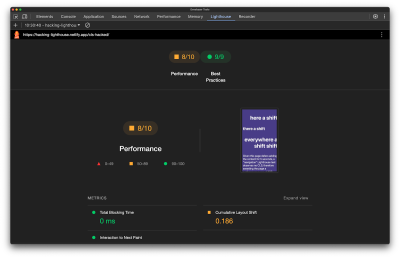
Whilst it is possible to defer layout shift events for a page load test, this hack definitely won’t work for field data and user experience over time (which is a more important focal point, as we discussed earlier). If we perform a “time span” test in Lighthouse on the page with deferred layout shifts, Lighthouse will correctly report a non-green CLS score of around 0.186.
If you do want to intentionally create a chaotic experience similar to the demo, you can use CSS animations and transforms to more purposefully pop the content into view on the page. In Google’s guide to CLS, they state that “content that moves gradually and naturally from one position to another can often help the user better understand what’s going on and guide them between state changes” — again, highlighting the importance of user experience in context.
On this next demo page, I’m using CSS transform to scale() the text elements from 0 to 1 and move them around the page. The transforms fail to trigger CLS because the text nodes are already in the DOM when the page loads. That said, I did observe in my testing that if the text nodes are added to the DOM programmatically after the page loads via JavaScript and then animated, Lighthouse will indeed detect CLS and score things accordingly.
You Can’t Hack a Speed Index Score
The Speed Index score is based on the visual progress of the page as it loads. The quicker your content loads nearer the beginning of the page load timeline, the better.
It is possible to do some hack to trick the Speed Index into thinking a page load timeline is slower than it is. Conversely, there’s no real way to “fake” loading content faster than it does. The only way to make your Speed Index score better is to optimize your web page for loading as much of the page as possible, as soon as possible. Whilst not entirely realistic in the web landscape of 2024 (mainly because it would put designers out of a job), you could go all-in to lower your Speed Index as much as possible by:
- Delivering static HTML web pages only (no server-side rendering) straight from a CDN,
- Avoiding images on the page,
- Minimizing or eliminating CSS, and
- Preventing JavaScript or any external dependencies from loading.
You Also Can’t (Really) Hack A TBT Score
TBT measures the total time after the FCP where the main thread was blocked by JavaScript tasks for long enough to prevent responses to user input. A good TBT score is anything lower than 200ms.
JavaScript-heavy web applications (such as single-page applications) that perform complex state calculations and DOM manipulation on the client on page load (rather than on the server before sending rendered HTML) are prone to suffering poor TBT scores. In this case, you could probably hack your TBT score by deferring all JavaScript until after the Lighthouse test has finished. That said, you’d need to provide some kind of placeholder content or loading screen to satisfy the FCP and LCP and to inform users that something will happen at some point. Plus, you’d have to go to extra lengths to hack around the front-end framework you’re using. (You don’t want to load a placeholder page that, at some point in the page load timeline, loads a separate React app after an arbitrary amount of time!)
What’s interesting is that while we’re still doing all sorts of fancy things with JavaScript in the client, advances in the modern web ecosystem are helping us all reduce the probability of a less-than-stellar TBT score. Many front-end frameworks, in partnership with modern hosting providers, are capable of rendering pages and processing complex logic on demand without any client-side JavaScript. While eliminating JavaScript on the client is not the goal, we certainly have a lot of options to use a lot less of it, thus minimizing the risk of doing too much computation on the main thread on page load.
Bottom Line: Lighthouse Is Still Just A Rough Guide
Google Lighthouse can’t detect everything that’s wrong with a particular website. Whilst Lighthouse performance scores prioritize page usability in terms of responding to user input, it still can’t detect every terrible usability or accessibility issue in 2024.
In 2019, Manuel Matuzović published an experiment where he intentionally created a terrible page that Lighthouse thought was pretty great. I hypothesized that five years later, Lighthouse might do better; but it doesn’t.
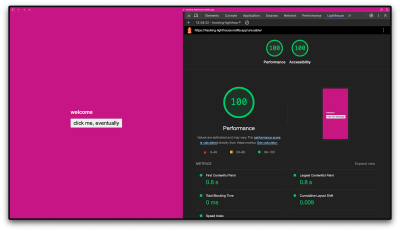
On this final demo page I put together, input events are disabled by CSS and JavaScript, making the page technically unresponsive to user input. After five seconds, JavaScript flips a switch and allows you to click the button. The page still scores 100 for both performance and accessibility.
You really can’t rely on Lighthouse as a substitute for usability testing and common sense.
Some More Silly Hacks
As with everything in life, there’s always a way to game the system. Here are some more tried and tested guaranteed hacks to make sure your Lighthouse performance score artificially knocks everyone else’s out of the park:
- Only run Lighthouse tests using the fastest and highest-spec hardware.
- Make sure your internet connection is the fastest it can be; relocate if you need to.
- Never use field data, only lab data, collected using the aforementioned fastest and highest-spec hardware and super-speed internet connection.
- Rerun the tests in the lab using different conditions and all the special code hacks I described in this post until you get the result(s) you want to impress your friends, colleagues, and random people on the internet.
Note: The best way to learn about web performance and how to optimize your websites is to do the complete opposite of everything we’ve covered in this article all of the time. And finally, to seriously level up your performance skills, use an application monitoring tool like Sentry. Think of Lighthouse as the canary and Sentry as the real-deal production-data-capturing, lean, mean, web vitals machine.
And finally-finally, here’s the link to the full demo site for educational purposes.
(gg, yk, il)